Goethe Graphed, 2001
Goethe’s Theory of Colours, Graphed
A Statistical Analysis of Goethe’s 1810 Treatise on Colour
The Goethe-Institut, 47 Clarence, suite 480, Ottawa, Canada
November 19th – December 13th, 2001
Make no mistake, this series is intended to be light-hearted. But in taking what is decidedly
wrong-headed approach to the analysis of Goethe’s Theory of Colours, something may be said about the contemporary fixation on statistics – a belief that numbers in and of themselves
constitute importance.
What I have done is to count all occurrences of colour words in Goethe’s theory, compile them
and then creates a series of comparative graphs. While the graphs seem to provide the viewer with a thorough and responsible analysis of the Goethe’s theory, they in fact offer little in the way of understanding this Romantic treatise on colour and art.
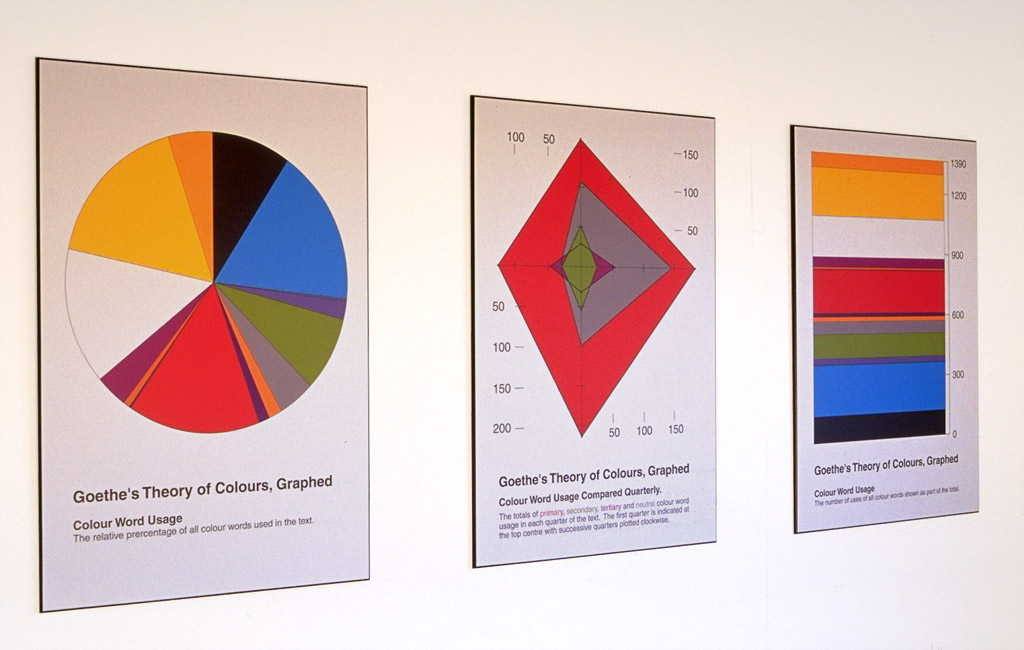
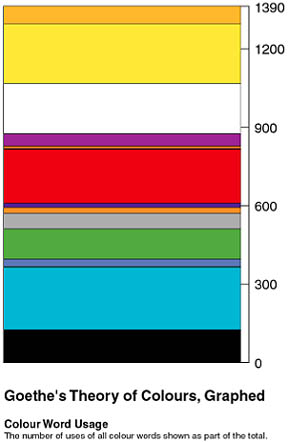
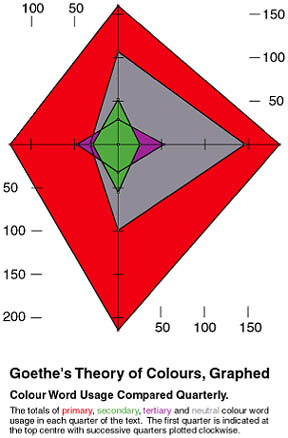
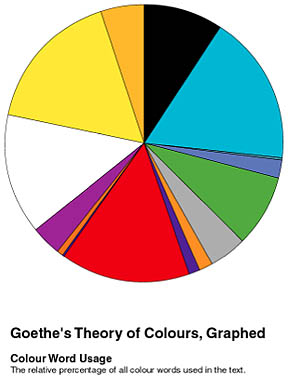
Like earlier series, this series presents images that appear very much like modern hard-edge abstraction, but that have a second literal meaning. In this flux of readings however there are some visual coincidences to be found that do illustrate some of Goethe’s observances on colour. The pie chart below, while an abstract composition in itself, does illustrate the relative percentage of primary, secondary, tertiary and neutral colour word usage in the text. Given the subject matter, the pie chart also begins to read as a colour wheel. In a like manner, the stacked bar graph illustrates the number of usages of the colour words, but also demonstrates the laws of simultaneous contrast (the effect certain colours have when abutted to another).
The pieces have been produced digitally and then laminated onto boards. This manner of presentation has been chosen so that pieces integrate into the academic atmosphere of the institute. Six images measuring 48″ x 32″ were produced for the series.


